


Dashboard for E-commerce Data Extractor
The DigitalMara team resolved a problem of usability for e-commerce data extractor by developing a user-friendly interface that united all components in the data-analytics ecosystem as a microservices structure. The system helps e-commerce players build their sales strategies, allowing them to focus on the market quickly and painlessly.

About the client
Tech startup from UK
A tech startup from the UK came to DigitalMara with an idea to create a unique solution for collecting web data at an enterprise level and building smarter analytics. A product aimed at analytics providers, brands, and retailers, helping e-commerce players build their sales strategies by focusing on the market quickly and painlessly.

Challenge
The client already had a complex extractor with legacy code, which could only be used by tech specialists. They needed a new user-friendly platform with a simple user flow. The DigitalMara team added to the system a new component that resolved the usability issue. The platform can now be used by marketers, sales, brand owners and business analysts.
For analytics providers, it is an opportunity to improve their product and provide additional service to their clients. Brands can gather evidence about which items are selling better and what attracts customers, i.e., the product itself and its representation on a product detail page. Retailers can study their competitors to help optimize their own sales.
Approach
In general, web data extraction tools automate the process of web harvesting and make it possible to obtain real-time web data from multiple sources. They can parse the HTML, fetch the data, and integrate it into the database.
The client’s technical solution pulled information from websites and analyzed it, but didn’t have a dashboard where the results of web harvesting were displayed. The entire process was too complicated and confusing.
Idea and realization flow
To enhance productivity, the client decided to develop a new data-analytics ecosystem as a microservices structure — which meant exchanging its old monolithic service for two new, lightweight services. The first one allows making HTML snapshots of product cards. The second sets the frequency with which snapshots are taken and requests are sent to the platform. The services were developed on the client side, while the DigitalMarа team integrated a new interface into the system. The platform with which the final user interacts sends a command to the first service. And if it can’t parse data, command goes to the old service. On the next development stage adding the second service to the flow is specified. In that way command goes to the second service, which sets a frequency for receiving data, and then to the first service.
The client had a vision of the final result and, accordingly, a pool of tasks for the DigitalMara team. They had a prototype and some mockups in Figma and were asked to build an MVP. The DigitalMara team started with an estimate, then worked out the UI/UX design for the product. In the next stage, developers got involved and came up with a specific platform that would become a user-friendly interface. It unites all the components into one system and allows the user to gather data from existing extractors and to see data from product details pages.
Functionality
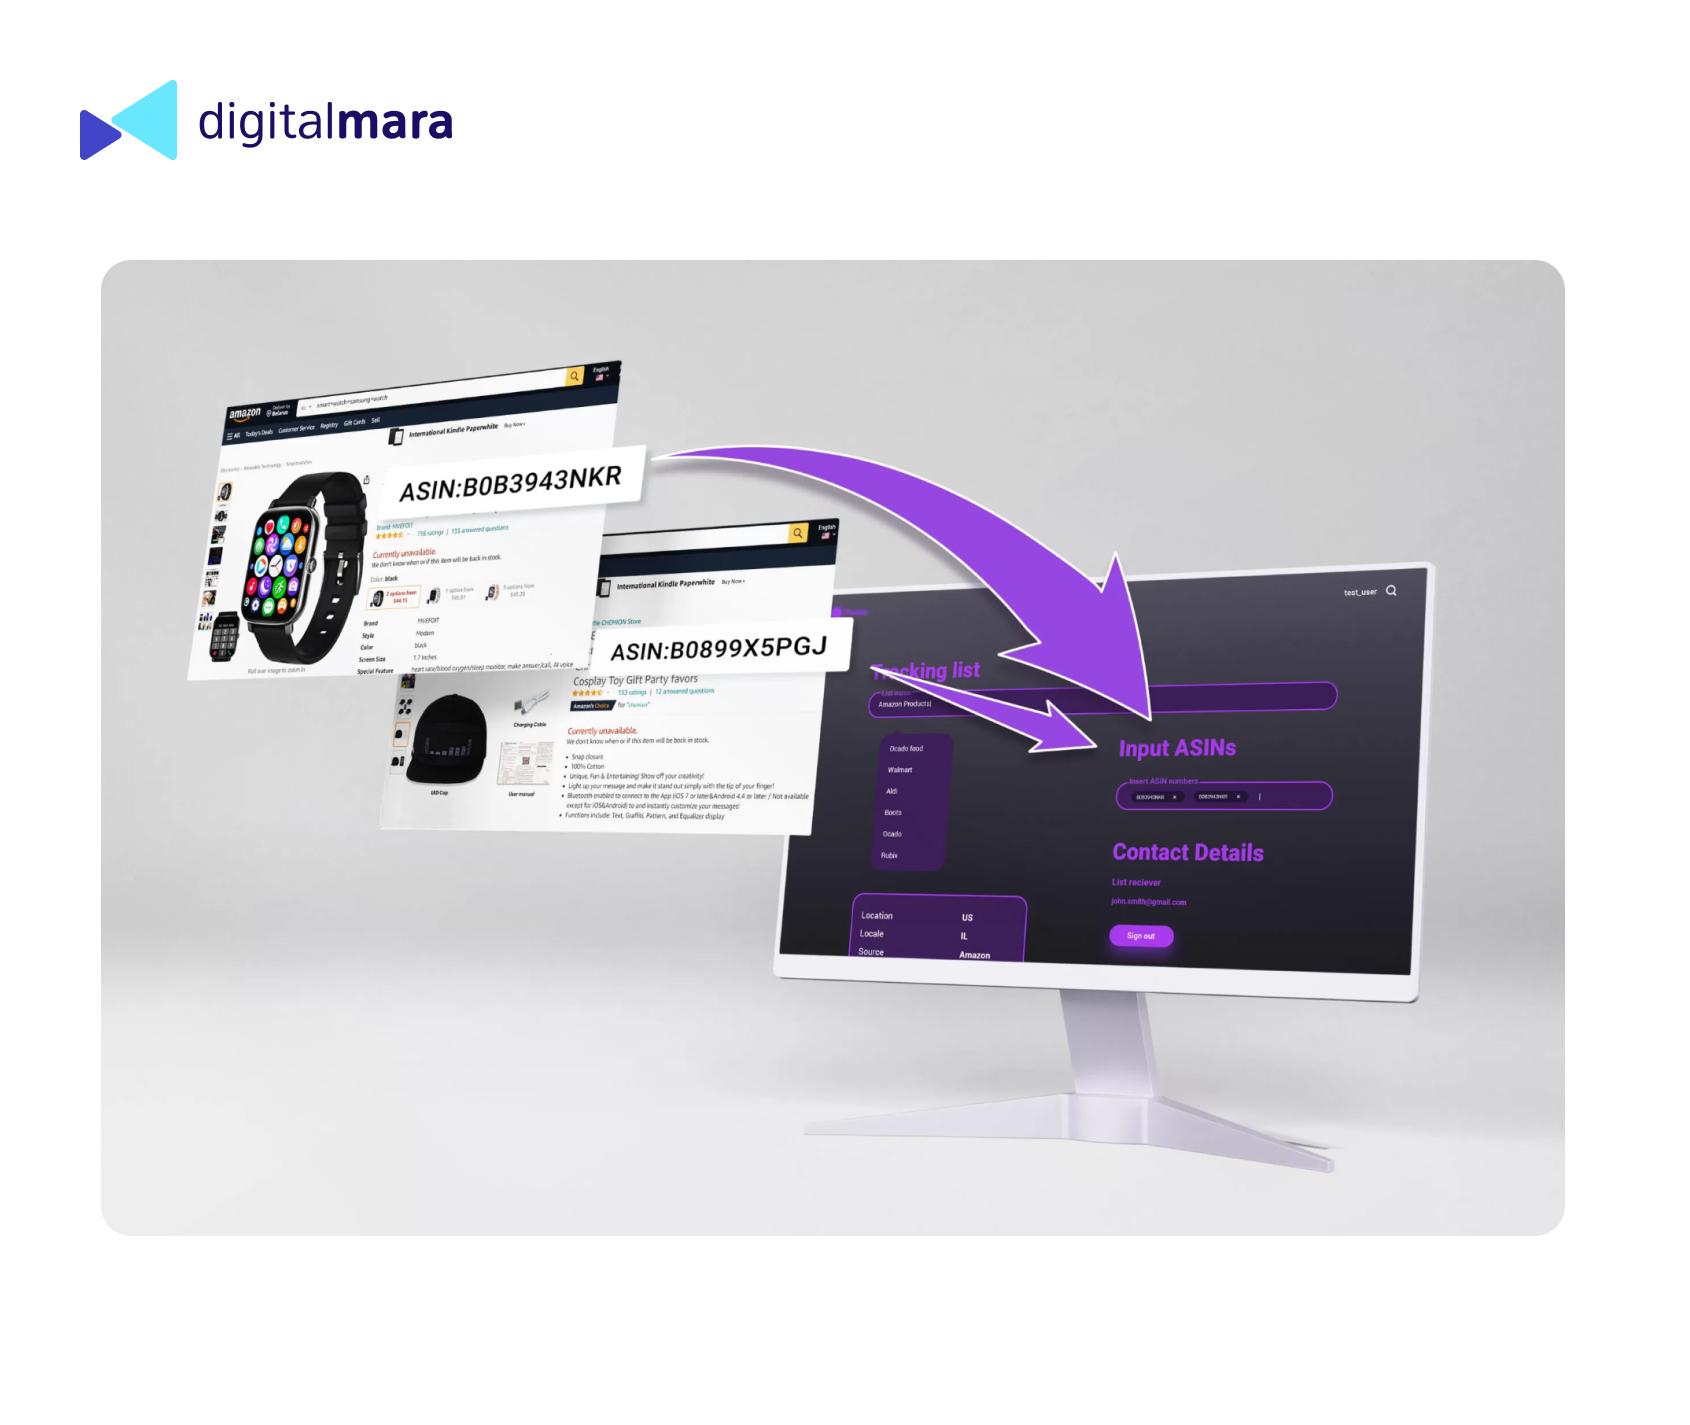
The platform has an easy-to-use and smooth user flow:
- Registration
- Choosing an e-commerce website
- Choosing the item
- Receiving snapshots with product info
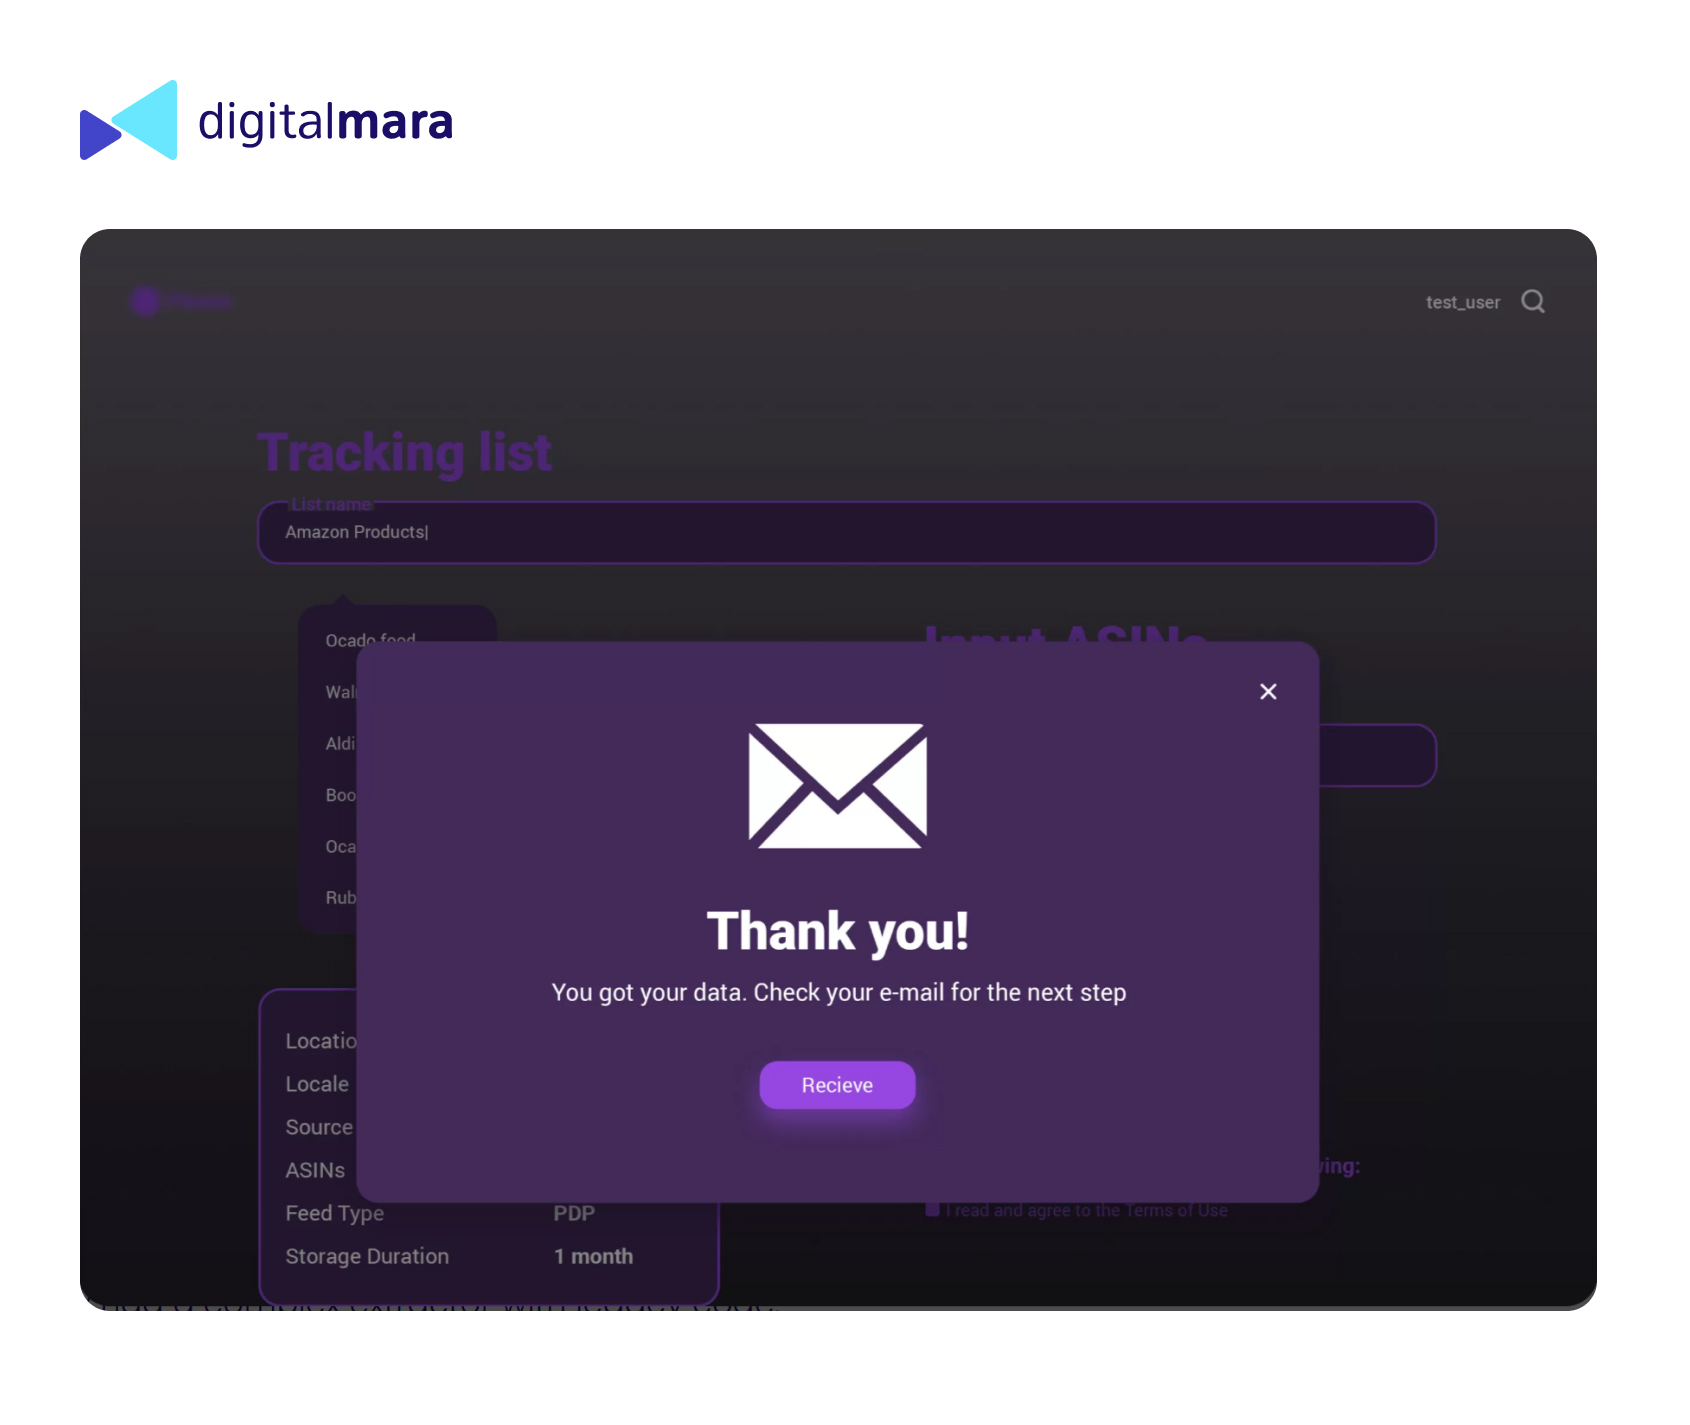
Trade items can be found according to Amazon Standard Identification Number (ASIN), keyword, stock keeping unit (SKU) and brand page URL. As the first stage, parsed data is exported to .ndjson format. As the next stage, for user convenience, the function of exporting to csv is specified. Data is visualized on the dashboard; the user receives detailed product info and can evaluate statistics dynamically for a particular time period.
Monetization on the platform is carried out through payments for requests to store product pages. The payment amount depends on the number of requests.
The platform was launched and tested with Amazon before several other e-commerce websites were added. The final version had 21 sources in total, such as ALDI, Boots, Ocado, RUBIX, etc. Each store had its own pre-written parser, provided by the client.
Results
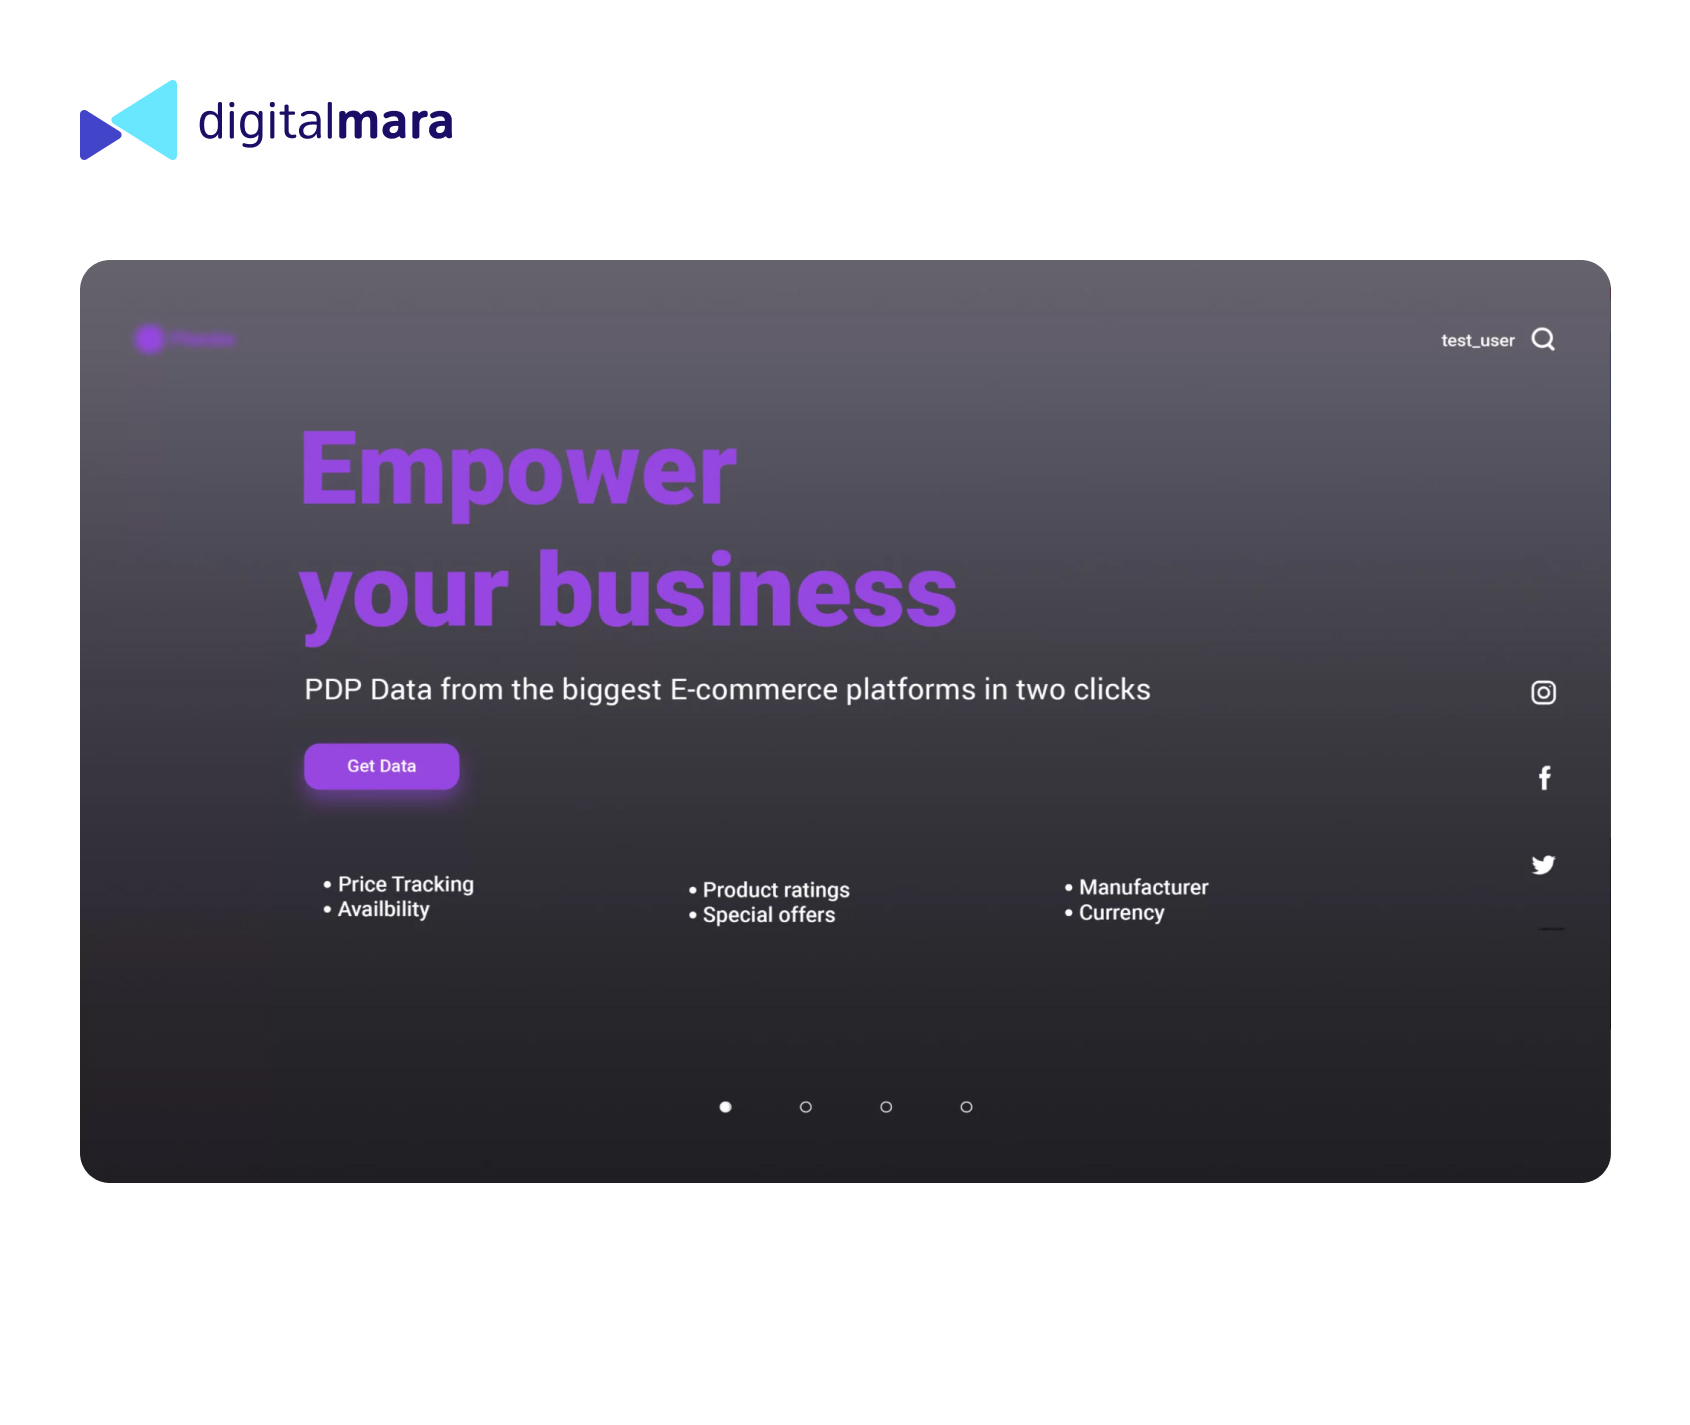
The developed platform allows users to choose and check out information in product cards from various e-commerce sites, comparing pricing policies and identifying working hypotheses about the most effective presentation of items to consumers. Based on this data, the client’s customers can make better predictions and operational decisions in their online stores and adjust their sales strategy accordingly. They can spend less time collecting information and more time analyzing data and making informed decisions.
Get case study as PDF
Thank you
The PDF has been sent to you via email. If you have any questions, please don't hesitate to reach out to us.
Similar case studies

Similar case studies
Evolution of the search algorithm for a proprietary insights platform
Similar case studies

Similar case studies
Restaurant Bookkeeping Solution
Similar case studies

Similar case studies
Upgrading Web app Cloud access platform for Smart homes